An overview of global warming sources from APEC, EU, and Taiwan
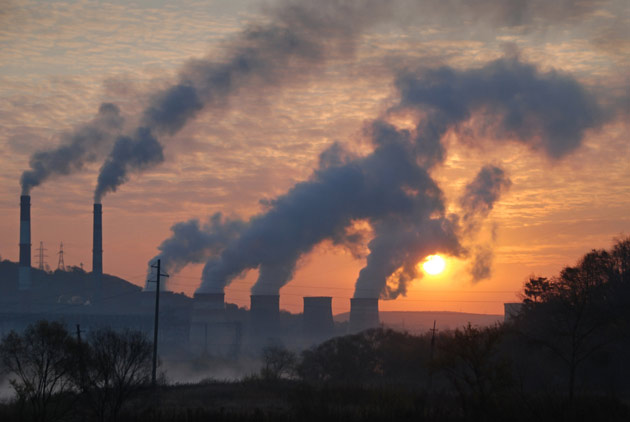
Source:Shutterstock
In contrast to world’s historical emissions by agricultural activities, the GHG emissions in Taiwan agricultural sector have shown a decreasing trend over the years. If Taiwan’s goal is to achieve net zero carbon emissions by 2050, what should be done?
Views
An overview of global warming sources from APEC, EU, and Taiwan
By Chia-Lin Changweb only
Before the Industrial Revolution, the global climate changed due to the natural causes such as variations in sunlight (Riebeek, 2010). Although volcanoes are active around the world and continuously emit carbon dioxide, the amount of carbon dioxide released was extremely small compared to human-made carbon emissions. Fossil fuel burning produces one hundred times more than volcanoes, which only emit between 130 and 230 million tons of carbon dioxide per year. Moreover, cutting down carbon-absorbing forests accelerates the climate change. As a result, the concentration of greenhouse gases in the atmosphere is at an ever-increasing rate to recent global warming data.
In response to the continuous deterioration of the global climate, 195 countries around the world signed the Paris Agreement on December 12, 2015. The Paris Agreement does not tell signatory countries what to do, but it sets its goals and allows countries to decide how to meet them. Countries that participated in the agreement are expected to submit their nationally determined contributions (NDCs) and long-term strategies to achieve the reduction of greenhouse gas (GHG, hereafter) emissions on a 5-year cycle. Most countries have set their goal to achieve net zero carbon emissions by 2050 (UNFCCC, 2021b).
The 2030 Agenda for Sustainable Development proposed by the United Nations Conference on Environment and Development (UNCED) in September 2015 was the main standard followed by countries around the world. The heart of the proposal are the 17 Sustainable Development Goals (SDGs) which call for action by all countries in global partnership to achieve balance while promoting social progress, spurring economic growth, tackling climate change, and preserving natural environments (UNDESA, 2021).
The European Commission adopted the European Green Deal on December 11, 2019, and viewed it as a blueprint for Europe to achieve the Sustainable Development Goals. The EU expects to implement 50 policies related to sustainability by 2020 and make Europe the first climate warming-neutral continent by 2050.
Carbon emissions
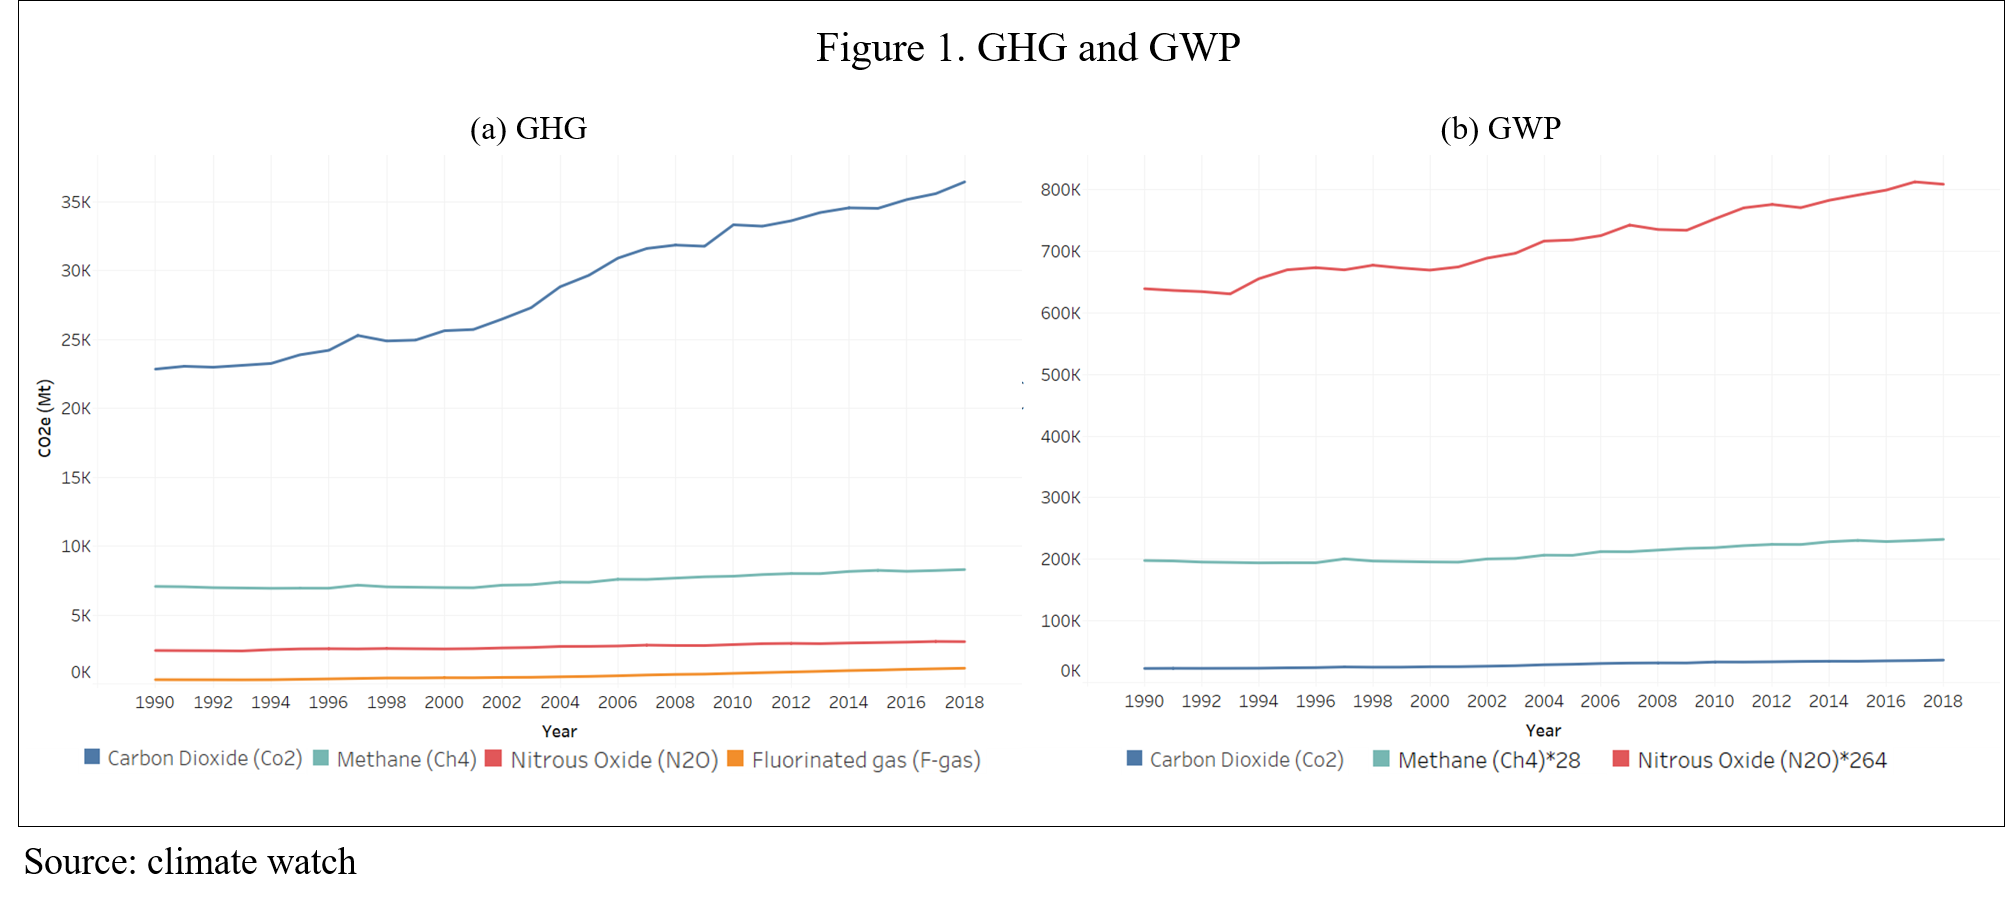
The categories of greenhouse gases are mainly divided into Carbon Dioxide (CO2), Methane (CH4), Nitrous Oxide (N2O) and Fluorinated gas (F-gas). Fluorinated gas (F-gas) includes Hydrofluorocarbons (HFCs), Perfluorocarbons (PFCs), Sulfur Hexafluoride (SF6), Nitrogen Trifluoride (NF3), etc.
In order to simplify the global comparisons of warming impacts of different gases in the atmosphere, IPCC proposed the Global Warming Potential (GWP) indicator to measure the effects of various greenhouse gases on the earth's surface over a period of time (usually used for 100 years). Carbon dioxide serves as a benchmark. As we can see in Table 1, the GWP of CH4 is 28 which means that the warming effect of one metric ton of methane is 28 times of that of the same amount of CO2 while the GWP of N2O is 264.

Global Greenhouse Gas Emissions
Based on the data from Climate Watch, carbon dioxide was the largest contributor in GHG emissions, followed by CH4 and N2O. Emissions of CO2 have increased during the past few years, while others remain nearly the same with less variation. However, GWP indicator shows that N2O has a substantial impact on global warming than CO2 and CH4. (Figure 1, a, b)
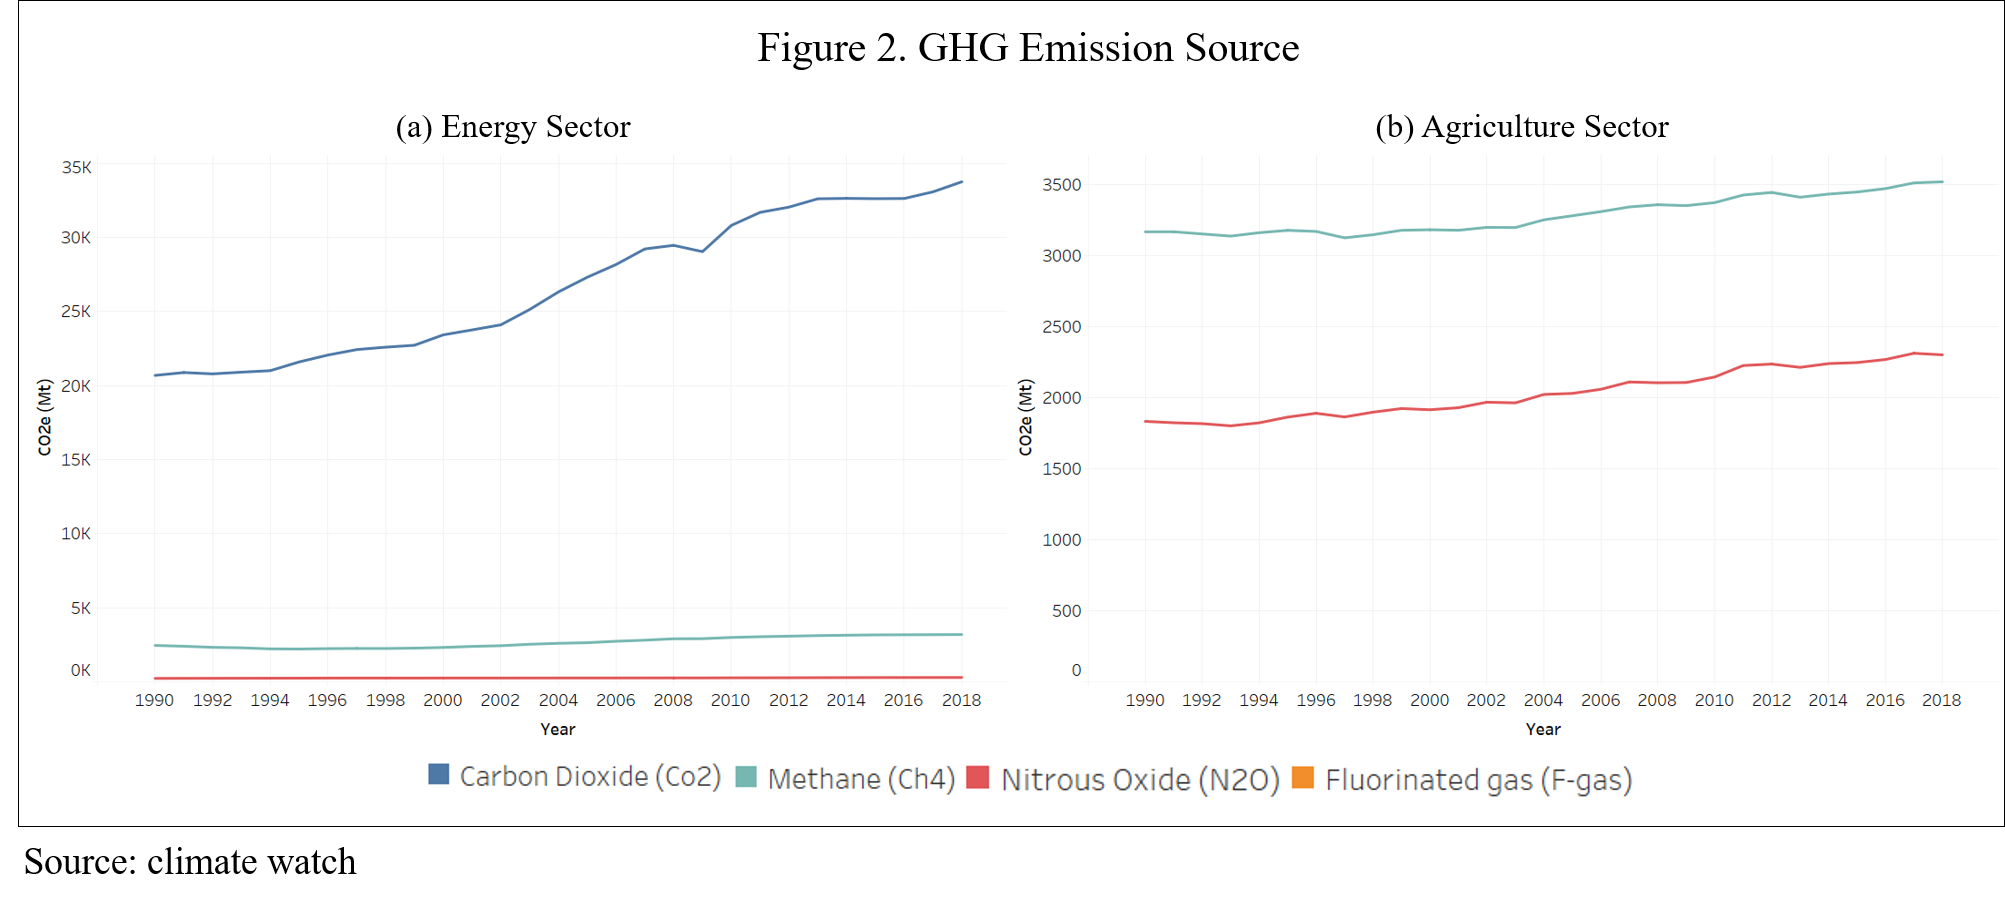
Observing the GHG emissions by global warming potentials (GWPs), agricultural sector has a larger impact on the global warming effect than energy sector (Figure 2).
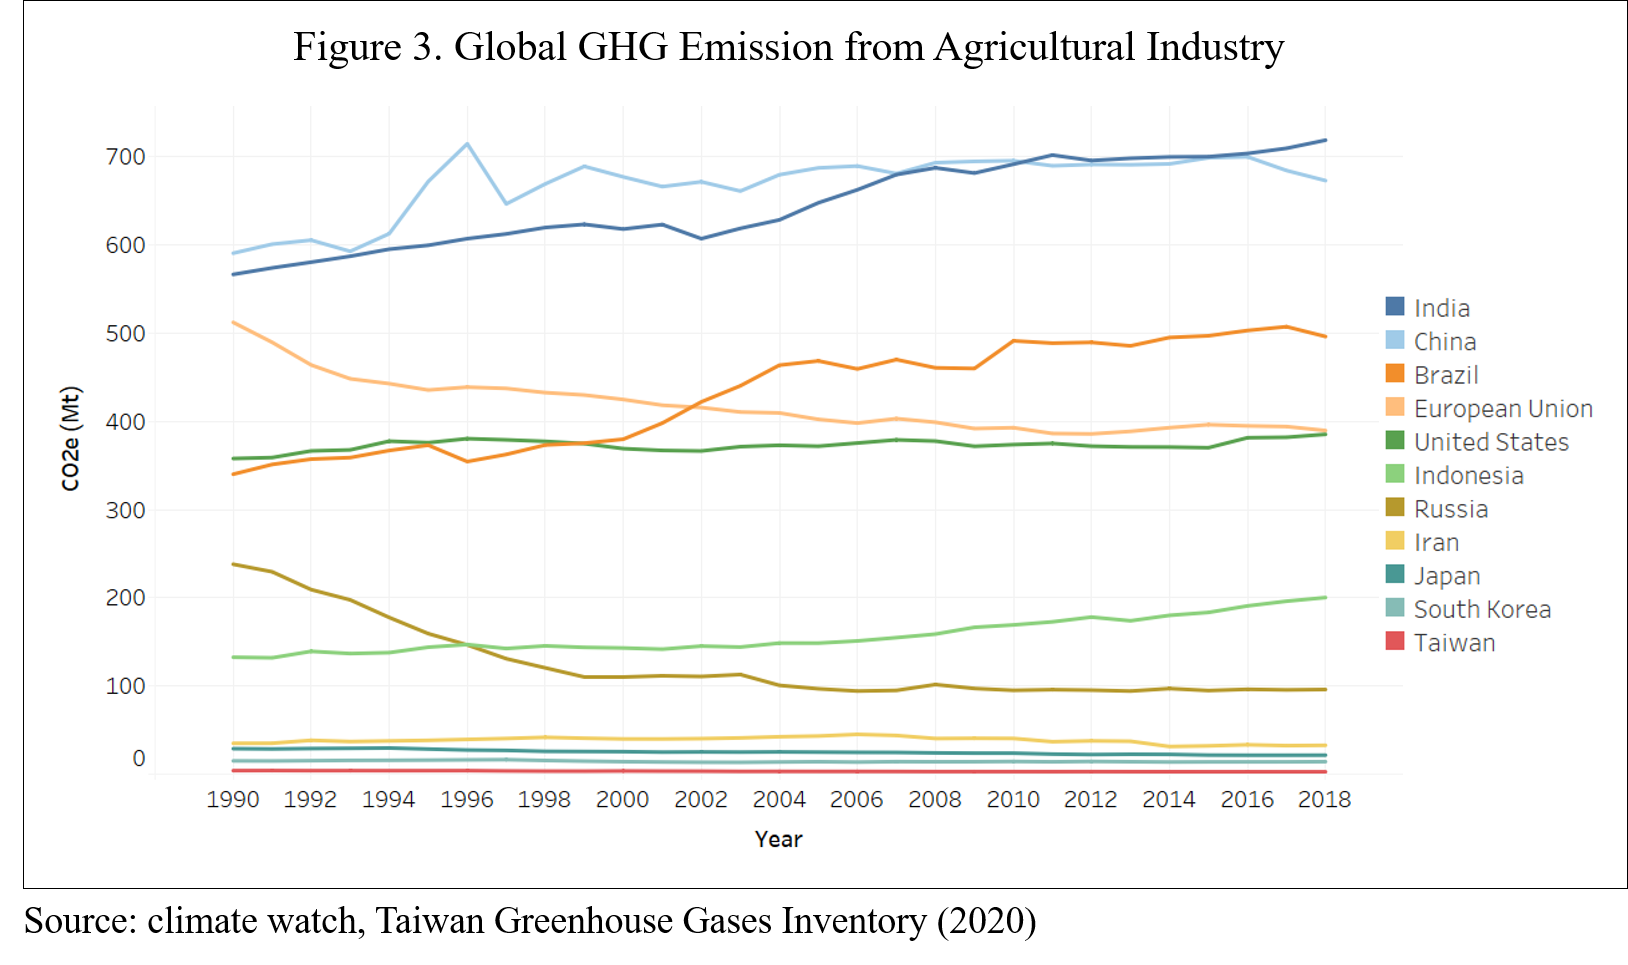
China and India are the top 2 GHG emitters in the agricultural sector worldwide. In recent years, the GHG emissions from India's agricultural sector have gradually surpassed China.
According to the Food and Agriculture Organization (FAO) Statistics, India ranked first in the world's milk producing nations with the largest number of bovine population (including cattle and buffalos), making it an important producer of beef and milk in the world.
EU countries have gradually decreased cattle population year by year, while the pig population (non-ruminant animal with less methane emissions) has gradually increased, accounting 20% of the total pork production in the world. This situation corresponds to the trend shown in Figure 3.
APEC, EU, and Taiwan
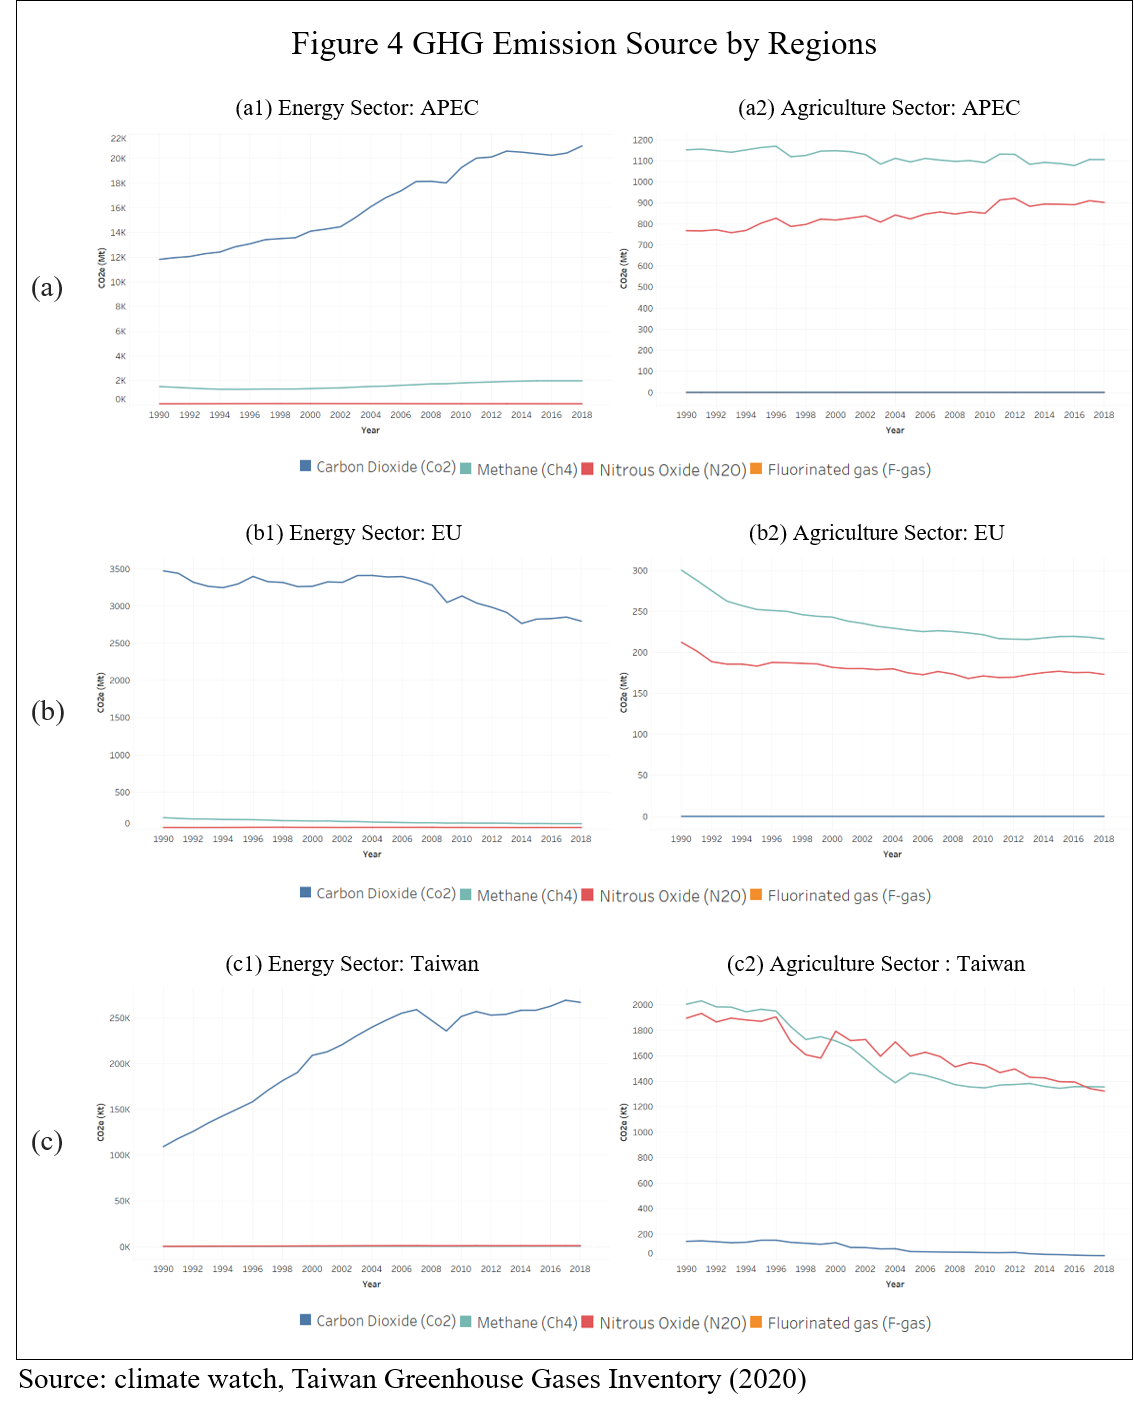
The energy sector was mainly responsible for CO2 emissions in APEC, EU and Taiwan, while emissions of CH4 and N2O in these areas were produced by the agricultural sector.
One of the reasons for the GHG emission decrease in Taiwan’s agricultural sector is that domestic agricultural production has been impacted by trade liberalization by the Taiwan's accession to the World Trade Organization (WTO) in 2002. Due to the decline in import prices and the reduction in production subsidies, agricultural arable land area and livestock production were reduced (Figure 4).
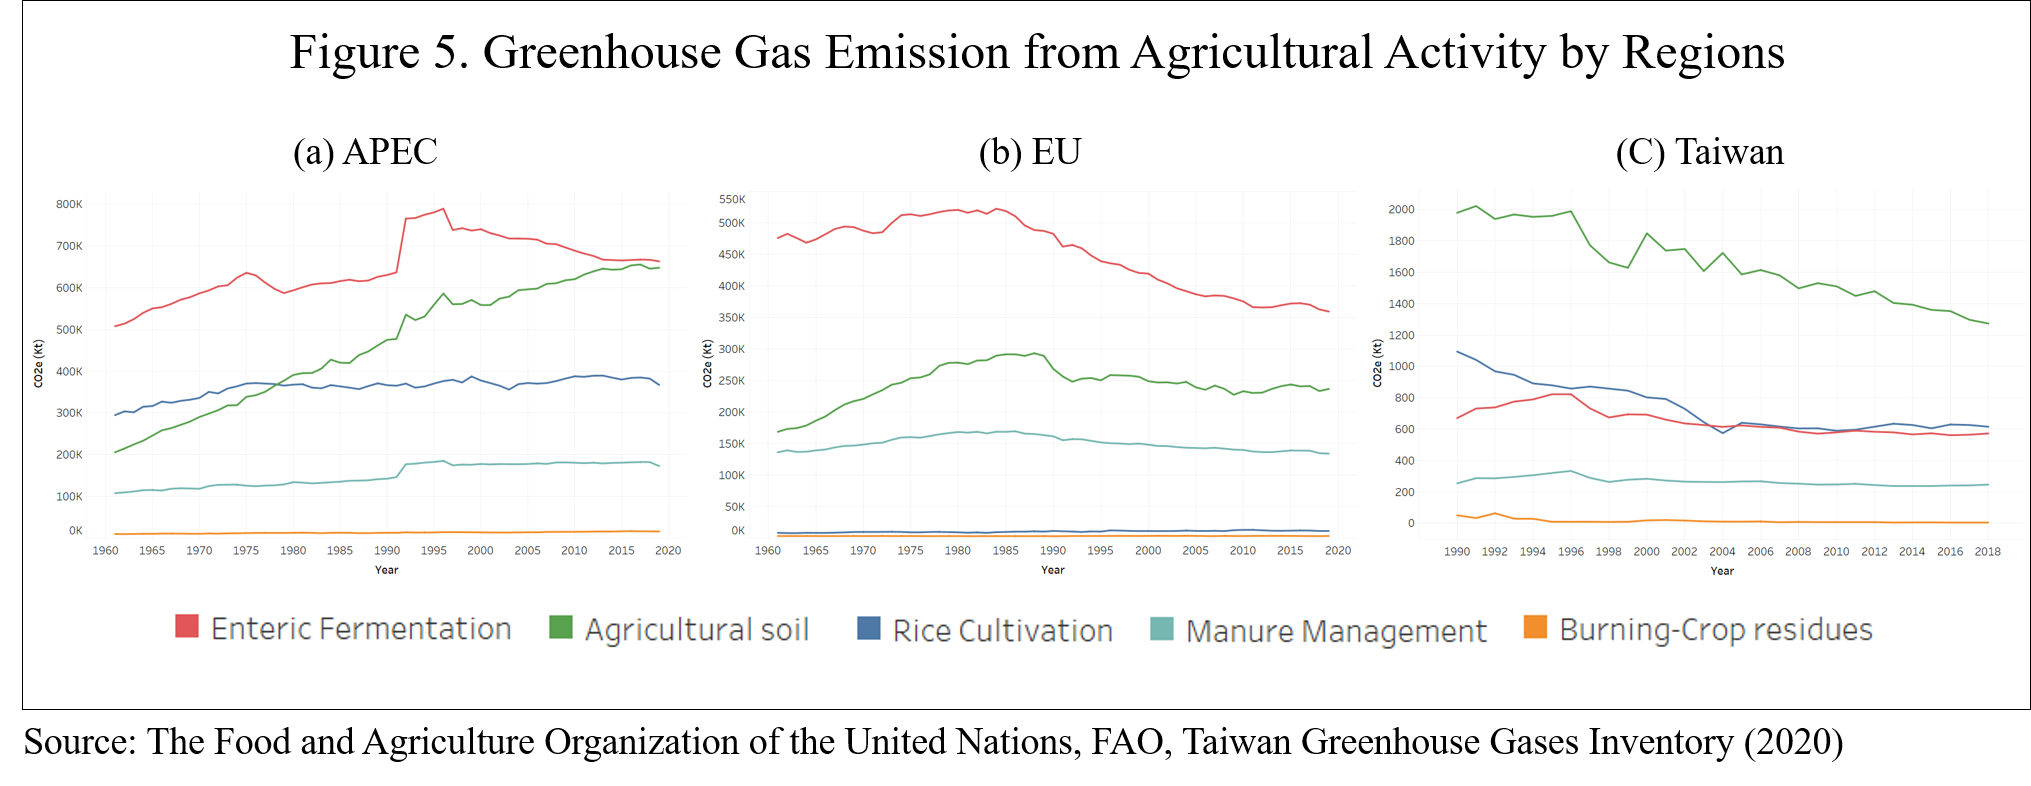
In APEC, the GHG emissions from enteric fermentation was the highest, followed by the activities in agricultural soil. As compared to APEC, the EU’s pursuit of a carbon emissions reduction goal under the European Green Deal has advocated the concept of replacing animal protein with plant-based alternatives to reduce livestock production.
In EU, the GHG emissions from enteric fermentation was the highest, but it has had a gradual annual decline. In contrast to world historical emissions by agricultural activities, Taiwan’s livestock industry was dominated by pig and poultry production which produces less methane emissions compared to ruminant livestock such as cattle, sheep, and goat. As a result, Taiwan’s GHG emissions from agricultural soil was the highest source, followed by rice cultivation and enteric fermentation (Fig.5).
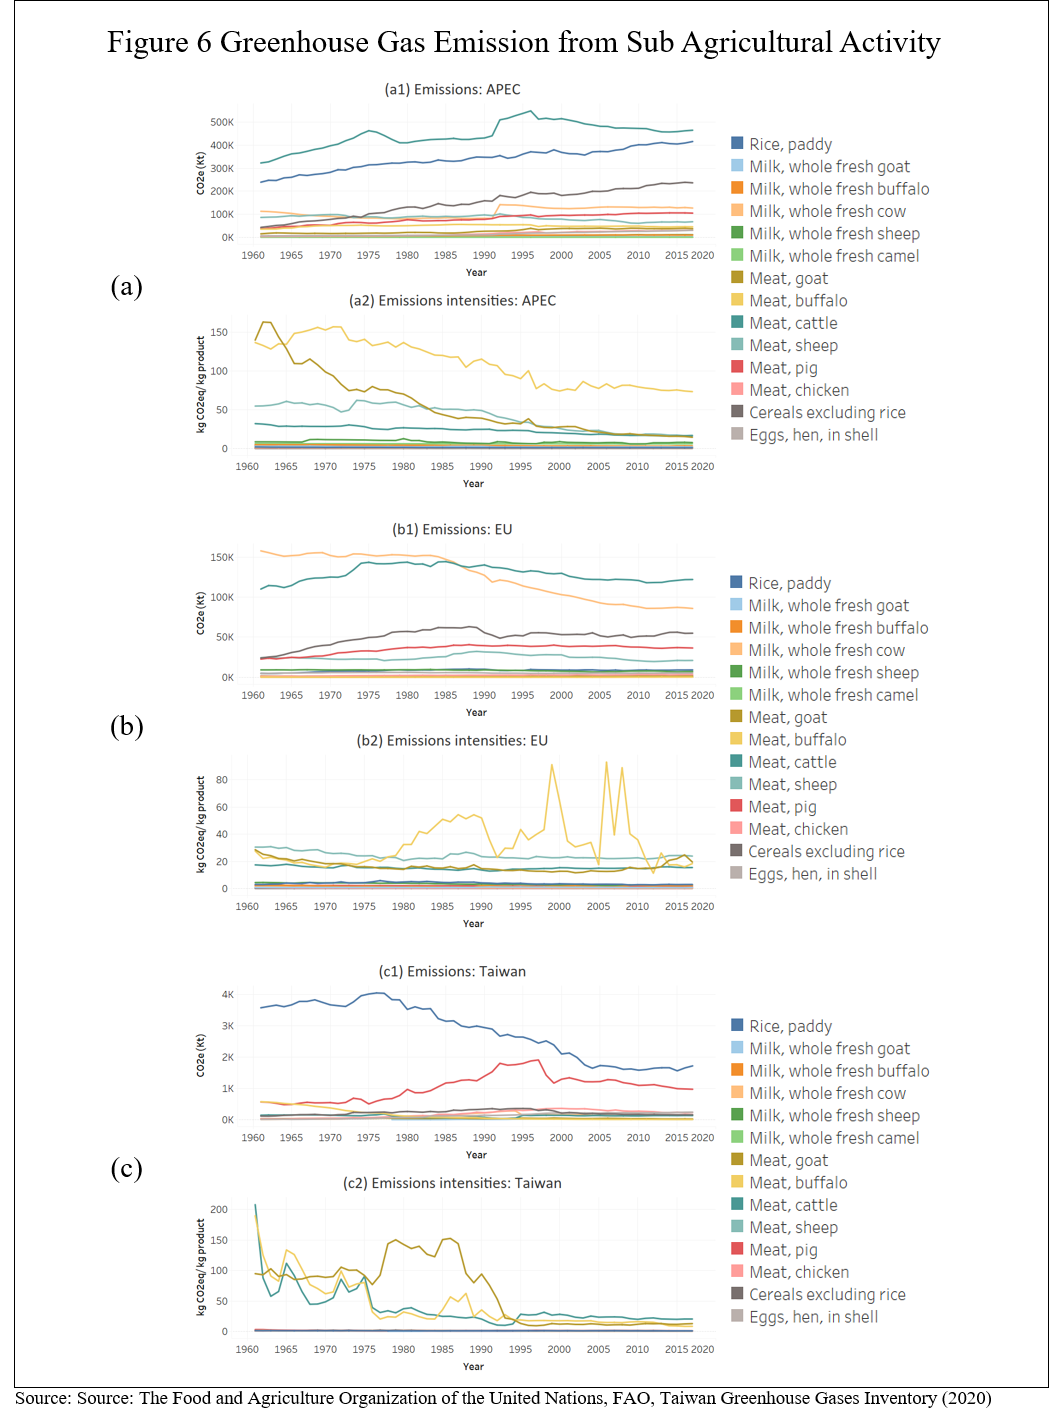
APEC’s historical emissions by sub-agricultural activities is presented in Figure 6. Meat (cattle) contributed the largest emissions, followed by rice, paddy and cereals. Meat (buffalo) had the highest emissions intensities, followed by meats from goat, sheep and cattle respectively. It is worth noting that APEC members’ economic efforts have proven effective for agricultural carbon reduction policies and strategies.
In the EU, beef meat contributes the largest emission followed by whole cow milk, cereals (excluding rice), and pork. Sheep meat has the highest emissions intensities followed by the meats of goat, buffalo and cattle. The emissions intensities of meat (buffalo) fluctuated widely, implying that agricultural activities in the livestock industry is still the primary source of GHG emissions.
Compared to EU and APEC, rice and paddy provides the highest emissions in Taiwan, followed by pork while meat (cattle) has the highest emissions intensities, followed by meat (goat) and meat buffalo). (Fig.6)
Conclusion
Energy sector in APEC, EU and Taiwan emissions were mainly coming from CO2 while CH4 and N2O in these areas were due to the emissions from the agricultural sector. Moreover, the global agricultural sector had also shown an increasing emission trend. In contrast to world’s historical emissions by agricultural activities, the GHG emissions in Taiwan agricultural sector have shown a decreasing trend over the years. If Taiwan’s goal is to achieve net zero carbon emissions by 2050, the government should create and strengthen its strategies to reduce its emissions intensity particularly in rice, swine and cattle production.
(This piece reflects the author's opinion, and does not represent the opinion of CommonWealth Magazine.)
About the author:

Chia-Lin Chang is Vice President for International Affairs, a University Distinguished Professor, Professor of Economics, Professor of Finance, and Director of the Agricultural and Natural Resources Research Centre (ANRRC) at National Chung Hsing University, Taiwan. She is an elected Fellow of the Modelling and Simulation Society of Australia and New Zealand (FMSSANZ). Her recent research interests focus on financial econometrics, financial economics, finance, energy economics and finance, time series analysis, forecasting, empirical industrial organization, risk management.
Have you read?
♦ How can the Legislative Yuan accelerate SDGs in Taiwan?
♦ Sustainability and development: Great bedfellows
♦ Net zero emissions: a core business priority
Uploaded by Penny Chiang
Views

Subscribe to CWE Newsletter (every Thursday)
Stay abreast of what's happening in Taiwan with our weekly digest.